The signal chain,
end to end.
A desktop engineering suite for software-defined radio work — synthesize modulated waveforms, recover the bits blind, dissect the resulting bitstream, and look at the signal in time and frequency, with a console that shows its math at every step. Licensing and evaluation enquiries go straight to the desk that built it.
Synthesize the signal you need.
Pick a scheme, shape the pulse, chain the coding — Belle renders the constellation and spectrum before a single sample hits disk. This is the Waveform Generator itself, mid-preview: a 32,767-symbol PRBS-15 through BPSK at 8 samples per symbol, root-raised-cosine shaped, its constellation and power spectrum measured from the samples it just produced.
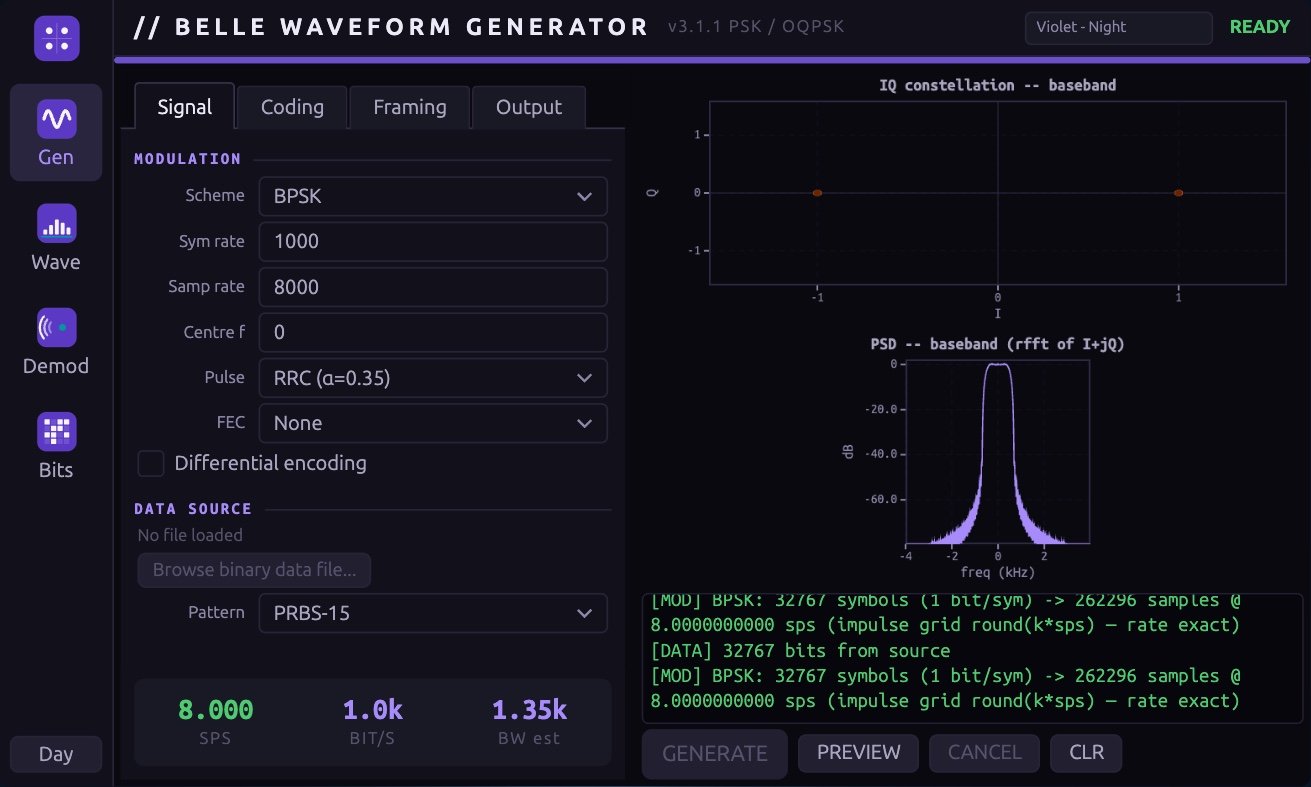
The generator, captured live from the exhibit on the bench — run by this site's own DSP engine
13 schemes, one dialog
BPSK through 64-QAM, FSK and MSK — with per-scheme symbol mapping you can edit by hand.
Pulse shaping done right
Root-raised-cosine filtering with configurable roll-off, previewed in the spectrum before export.
Coding chains
Convolutional FEC, scramblers and randomizers stack in the order real waveforms use them.
Recover bits you didn't transmit.
Costas carrier recovery and Gardner timing pull the constellation into lock, while the LFSR analyzer identifies the scrambler that's hiding the data.
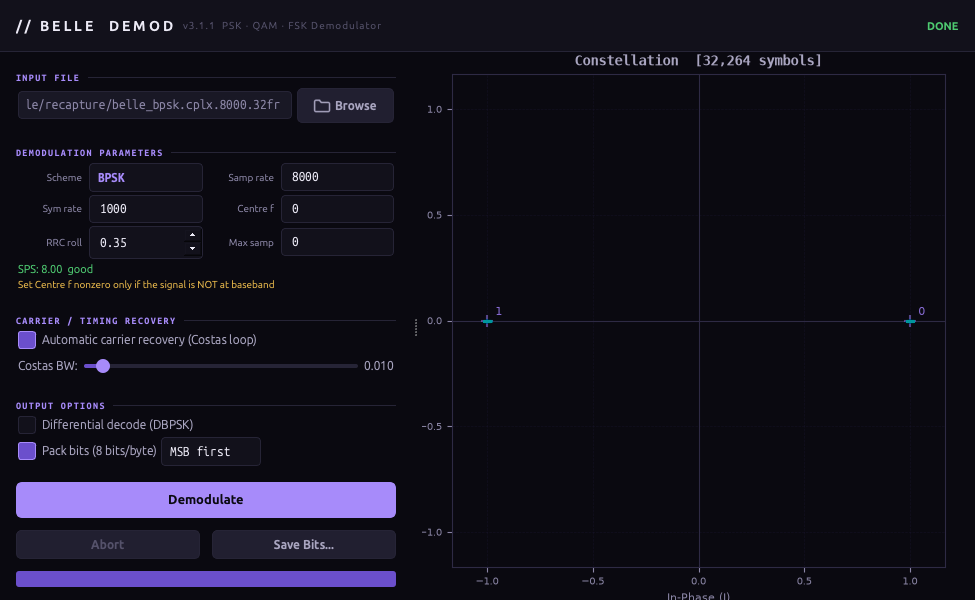
The shipped Demodulator, on a real BPSK recording it just recovered
Blind lock
Costas + Gardner loops converge without a training sequence — watch the clusters tighten live.
Honest metrics
Bits, symbols and EVM update as the loop settles, so you know the demod is real, not lucky.
Scrambler cracking
The LFSR analyzer sweeps candidate polynomials and scores them by period match and entropy drop.
See the structure inside the bits.
A visual bit-raster with chainable worksheet operations — descramble, deinterleave, frame-sync — and a shelf of analysis tools for whatever's left.
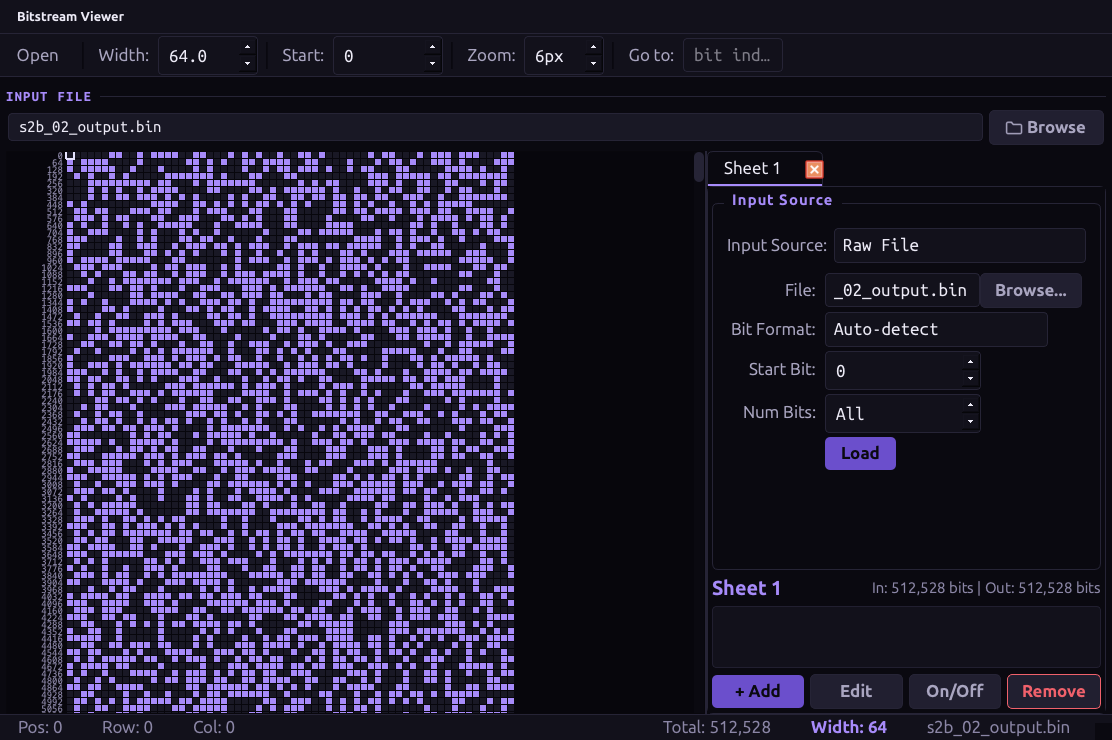
The shipped Bitstream Viewer, on a demodulated file
Worksheets, not scripts
28 bit operations — invert, deinterleave, derandomize, Viterbi, Reed-Solomon — chained visually per tab.
Sync jumps out
Solid columns in the raster are frame alignment made visible; the viewer finds the width for you.
13 analysis tools
Dockable panels for bit statistics, telecode, RS detection, audio playback and LFSR tap search.
Look before you decode.
The Waveform Viewer opens any recording in the time domain, as a power spectrum, as a spectrogram, as an I/Q scatter or a time raster — with a marker toolkit for measuring what you see.
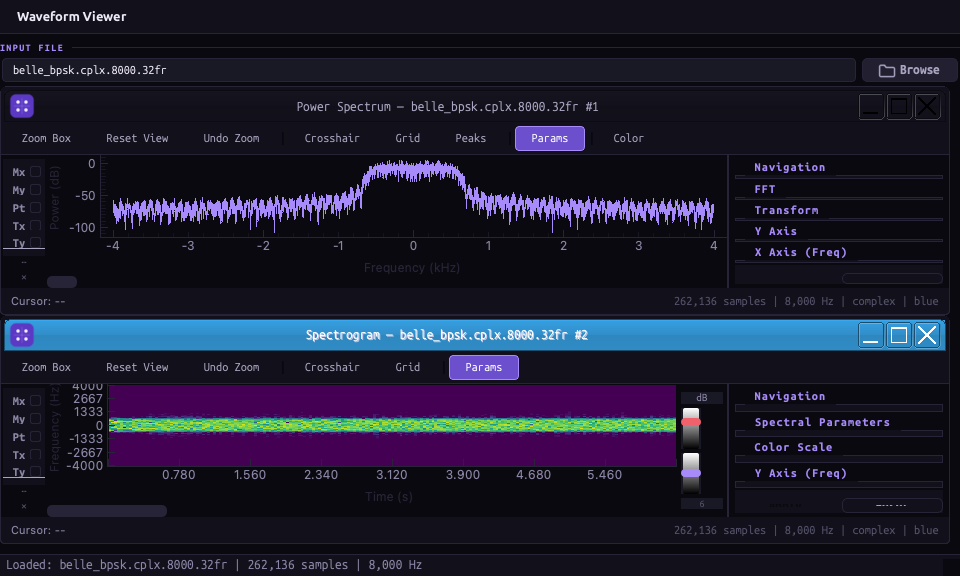
The shipped Waveform Viewer — power spectrum and spectrogram of the same BPSK recording
Five displays, one file
Time domain, spectrogram, power spectrum, I/Q scatter and time raster, each in its own subwindow over the same samples.
Markers that measure
Drop markers on any display and read frequency, time and level differences straight off the plot.
One suite, one look
Four palettes — violet and navy, night and day — shared by every tool, with Belle's own type throughout.
One suite, four tools.
13 modulation schemes
BPSK, π/2-BPSK, QPSK, π/4-QPSK, OQPSK, 8-PSK, QAM to 64, FSK and MSK — generated or demodulated.
Blind demodulation
Costas carrier recovery and Gardner timing with a live constellation and EVM readout across all schemes.
LFSR recovery
Automatic scrambler polynomial identification with period, entropy-drop and confidence scoring.
FEC lab
Viterbi decoding of K=7 convolutional codes, punctured rates, and Reed-Solomon (255,223).
Bitstream workbench
28 chained bit operations and 13 dockable analysis tools over a dual-view synchronized raster.
Waveform viewer
Time domain, spectrogram, power spectrum, I/Q scatter and time-raster displays with a full marker toolkit.
No analytics, no cookies, nothing collected — the policy says so in full.